Lecture 11
Topic 9: Behavioral Factors and Stock Market Puzzles
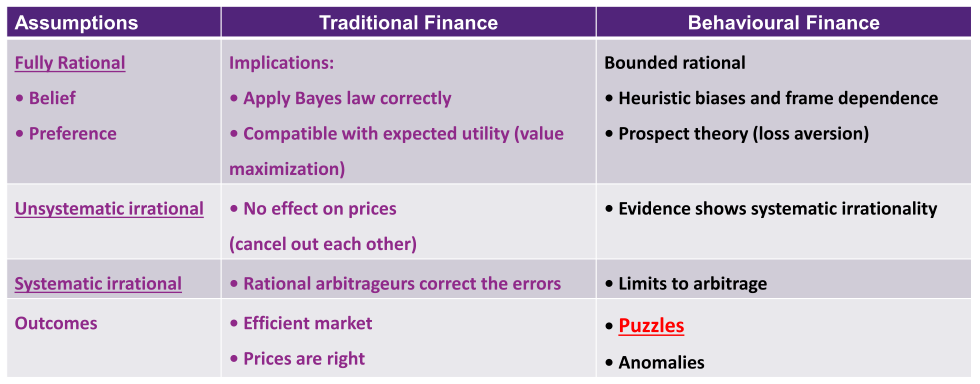
- We argued that behavioral considerations can contribute to an understanding of certain anomalies in the pricing of individual stocks.
- There we took a cross-sectional (or individual stock) approach. If we aggregate the market values of all stocks in the market, we have the aggregate value of the stock market.
- It turns out that, just as there are cross-sectional anomalies, there are also aggregate stock market puzzles.
- Market puzzles in today's lecture
Big Market Puzzles
Several big puzzles relate to aggregate stock market – behavioral finance has partial explanations for some of these puzzles:
- Equity premium puzzle: Stock returns are higher than they should be given risk borne by investors in stock markets
- Bubbles: Why do markets get so far out of line with fundamentals?
- Excess volatility: Stock returns are more volatile than they should be given that stock prices are present values of future expected cashflows
- Equity is volatile - is it too volatile?
- What is the benchmark we compare it to
Historical (Realised) Equity Premium in U.S.
- Historically, a well-diversified portfolio of stocks has substantially outperformed fixed-income securities.
- Important to look at real returns which control for inflation effects.
- The difference between expected equity return and fixed-income return is known as equity premium.
- The equity premium is defined to be the gap between the expected return on the aggregate stock market and a portfolio of fixed-income securities.
- On this basis, the equity premium can be calculated in a number of ways:
- it depends on whether you use arithmetic versus geometric average returns, the sample you employ, and what your market and fixed-income proxies are.
- No matter what method we use, all seem to point that the equity premium is too high
The Equity Premium
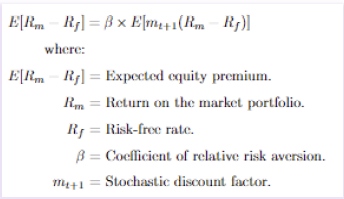
- Observed vs. Predicted Equity Premium: Historical U.S. Equity Premium (20th Century): Roughly 6% (HIGH). Predicted by classic models: Less than 1% (LOW).
= > Extremely High-Risk Aversion needed ( 𝜷 Values) / unrealistically high levels of consumption volatility. Theorists have shown that realised equity premium implies an improbably large degree of risk aversion. In an economy with reasonable parameters, the average return on the stock market would be just 0.1% higher than the risk-free rate, not 3.9% (or higher) observed in most studies.
- Adjusting for risk, should be less than 1% excess return
- Same risk level
- Trying to find an explanation: high equity premium means investors are risk averse
- Can be incorporated into beta
The Equity Premium: Total Nominal Return Indexes: 1802-1997
Investment Growth from 1802 to 1997 (Jeremy Siegel's Data)
- Data Period: 1802 - 1997
- Initial Investment: $1 "let it ride" in various asset classes.
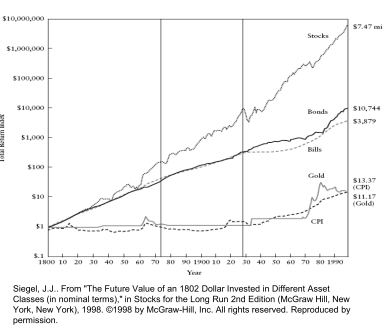
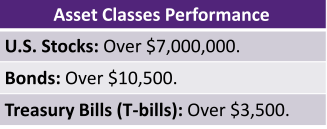
Stocks have historically provided much higher returns over the long run compared to other asset classes.
- Can the risk really justify the difference you can get?
(based on the Consumer Price Index - CPI).
- Insight: $1 in 1802 had significantly more purchasing power than in 1997, emphasizing the importance of accounting for inflation in long-term investment analysis.
- Now all returns are on a real (or constant-dollar) basis.
- Stocks are tamed to some extent, but a $1 investment still grows to over $550,000, versus less than $1,000 for bonds and bills, and (perhaps surprisingly to some) less than $1 for gold.
- Accounting for inflation - still a huge difference
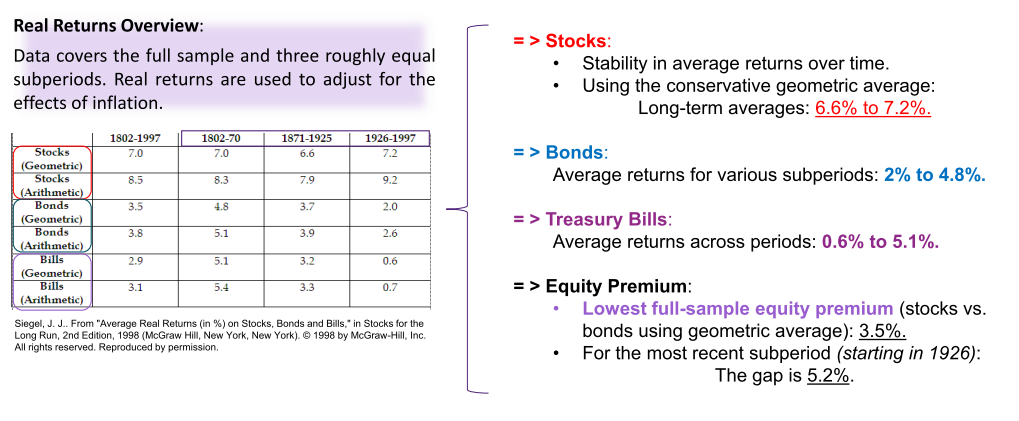
- Doesn't matter the period, still performing a lot higher than bonds and T-bills
- Even the smallest gap was 3.5%
- most recent study, the gap was 5.2%
Is Equity Premium Too High? Why is the Equity Premium a Puzzle?
Many theorists believe equity premium is too large for actual risk. Especially clear when we look at longer horizons:
- At longer horizons stocks almost always outperform, plus risk of stocks declines more quickly than would be expected.
Risk vs. Returns:
- Stocks are inherently riskier → higher expected returns.
- However, the observed equity premium contradicts conventional wisdom on risk preferences.
Expected Utility Theory:
- Implies an unreasonably high-risk aversion to justify observed returns.
Mehra & Prescott Argument:
- Equity Premium with reasonable risk aversion = 0.1%
Coefficient of Relative Risk Aversion (CRRA):
- Typical value from logarithmic utility function: CRRA=1.0
- Observed equity premium suggests: CRRA=30
- The higher the CRRA, the more risk averse an individual is.
Certainty Equivalent Analysis:
- Prospect: P1(0.50,$50,000,$100,000)
- With CRRA=30, the certainty equivalent x=$51,209.5
- Risk level for stocks, the longer the time horizon, the less risky the investment
- risk less decreases more than expected
- Can get higher earnings, even though you are bearing higher risk
- Even though more risky, short not give that much expected return
- High amount of equity premium - very risk averse
- Thirty times more risk averse than the reasonable risk aversion
- If you have a prospect
ERP Behavioural Explanation
On the behavioural side, there are two main explanations:
- One is based on ambiguity aversion.
- A second one, as proposed by Shlomo Benartzi and Richard Thaler, is based on loss aversion and mental accounting.
ERP Behavioural Explanation – Ambiguity Aversion
Ambiguity Aversion:
Puzzle implies an implausibly high risk aversion.
-
Consideration: Investors may be both risk averse and ambiguity averse.
-
Ambiguity: Uncertainty not just in outcomes (returns), but also in the distributional parameters themselves.
-
Plausible Values: By factoring in both risk aversion and ambiguity (or uncertainty) aversion, a 5% equity premium becomes reasonable. Historical Returns (Table 14.1): Stocks (Geometric): 7.0% (1802-1997), with variations across subperiods. / Bonds & Bills: Generally lower than stocks; details provided in table.
-
Survey Evidence:
-
Reveals disagreement on the ex-ante equity premium level.
-
Implication: Uncertainty about the mean of the return distribution.
-
Effective Risk Aversion: In situations of uncertainty, the perceived risk aversion effectively increases.
- Bet with picking out from a bag of balls and weren't given the colour
- Not enough information to tell you what could influence the outcomes, will be more risk averse
- Prefer a non-risk
Conduct a survey
- investors have no idea on outcomes (premium level) from investing in the equity market
- Market on investors have high level of uncertainty and ambiguity
ERP Behavioural Explanation – Loss Aversion and Mental Accounting
Researchers have linked prospect theory to the equity premium puzzle.
- lambda incorporates loss aversion in negative domain
- negative feeling is going to be larger because of loss aversion
ERP Behavioural Explanation – Loss Aversion and Mental Accounting
- Mental accounting involves categorising financial information into distinct and manageable blocks.
- This method impacts how individuals evaluate and perceive their financial data. Often, people don't scrutinise their portfolios continuously, leading to passive oversight of short-term gains or losses.
- However, periodic reviews make them more aware of their financial performance. At these moments, they might "book their losses," essentially separating past financial decisions from future ones.
- Due to an aversion to losses, individuals are likely to avoid investments with high chances of negative returns when they eventually assess their portfolios.
- Investing the stocks - not actively managing it
- Still going to look at portfolio, but not evaluating it
- Passive oversight of short terms gains or loss
- mental accounting - segregate out losses
- Book in a loss, separate past performance with future financial position
ERP Behavioural Explanation – Myopic Loss Aversion
- Myopic Loss Aversion: investors focus too much on short-term losses while ignoring potential long-term gains
- Key is to remember loss aversion (investors hate losing money) and to consider how often investors evaluate their portfolios
- Intuitively, if you evaluate your position every day, there is a very good chance that by day’s end you will have lost money, so you find stocks very risky.
- But if you evaluate stocks once per decade there is a much smaller chance that you will lose money, so you will find stocks not so risky
QUESTION:
Given the prospect theory approach, what evaluation period is consistent with historically observed market risk premium?
ANSWER:
About a year – which is logically how often a typical investor gives his portfolio a careful look.
Reasons:
- Tax is paid annually
- Portfolio assessment and adjustments are often annual
- Looking at portfolio, more aware of performance
- More losses, you will find the stock markets to be more risky
- evaluate every 10 years, you will find less risky
- Typically re-evaluate portfolio every year
- More often you reevaluate, you fixate on losses
- Use behavioural finance to explain why we have high loss aversion
- How frequent we evaluate affects loss aversion
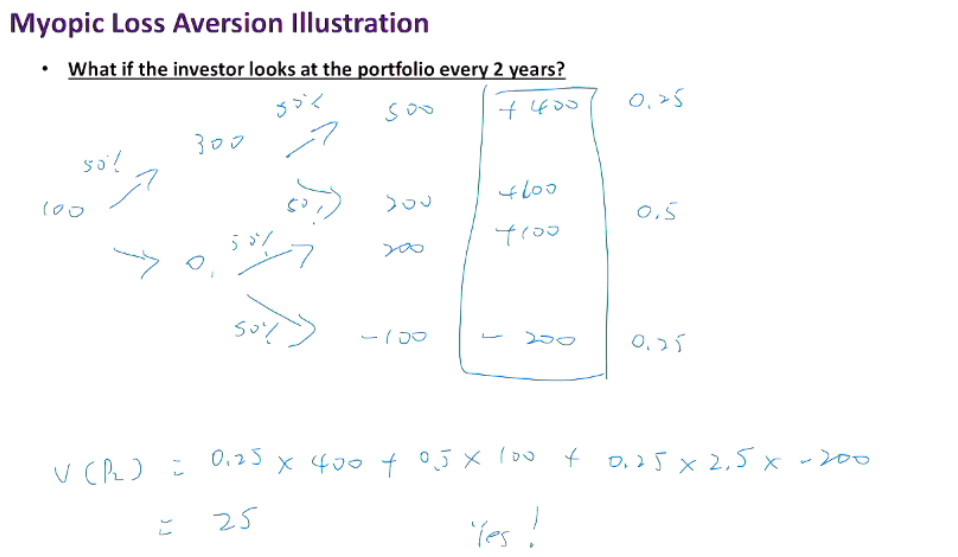
Myopic Loss Aversion Illustration
Consider the following prospect: P2(0.50, $200, -$100).
- Individual has 2 choices:
- Invest $100 in a savings account (assume zero return)
- Or buy stock with 50/50 distribution for net earnings of $200 or -$100
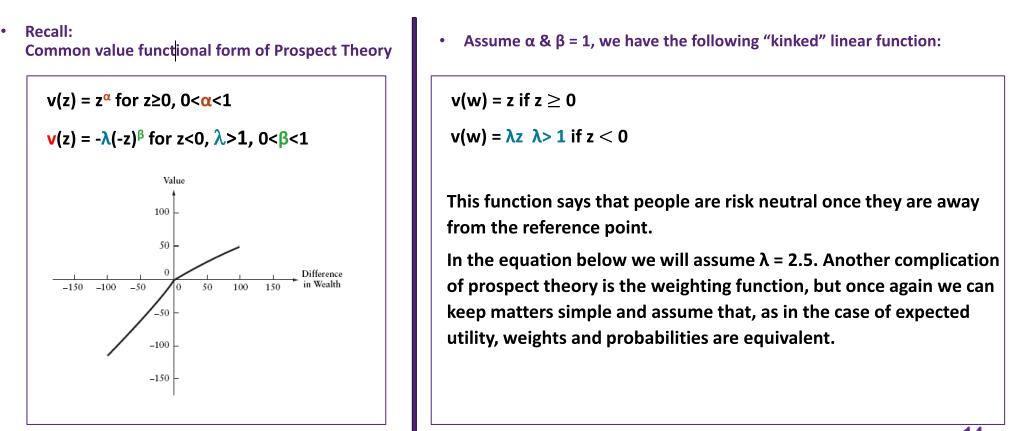
- If we assume loss aversion and linearity, value function is: v(z)=z for z≥0 & v(z)=λz for z<0 (λ>1)
- If λ = 2.5, will investor invest in stock? (assuming she looks at her portfolio once per year).
- Assuming we have this prospect:
- Winning 100 or losing 100
- Anything larger than 0, we will take it, anything less than 0 we will not take it
- Expected value of prospect, average outcomes of all prospects
- Evaluating portfolio more frequently, experience negative feelings towards investment
- Ask higher premium if you believe you experience more risk
- Less frequent evaluation leads to:
- ✓ higher demand for stock
- ✓ higher price of stock
- ✓ lower equity premium
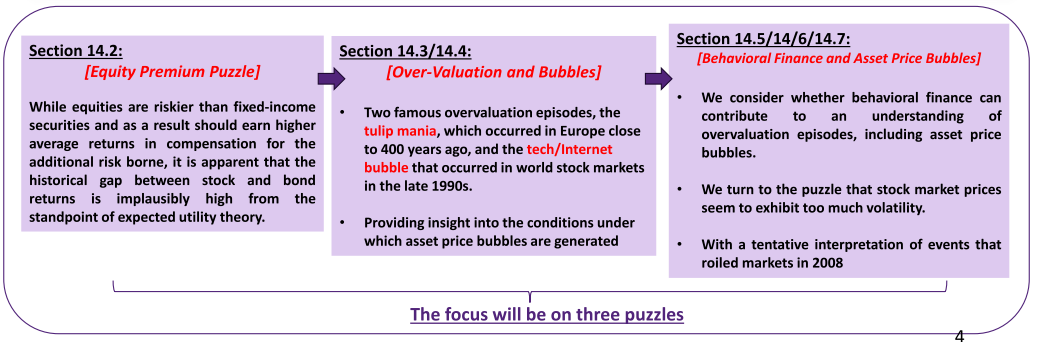
What is a Bubble?
A bubble occurs when prices are driven more by enthusiasm than fundamentals.
- Bubbles are identified in hindsight, leading to hindsight bias.
- E.g., Investors claiming, they saw it coming.
- Prices are mostly driven by enthusiasm
- Excitement/sentiment of individual
Real-World Bubbles
Stock Market Valuations & Oversights
- Stock valuations can diverge from actual corporate performance.
- Example: Enron's bankruptcy and high investor valuation.
Nasdaq Composite Index:
- March 10, 1999: Closed at 2,406.00
- March 10, 2000: Peaked at 5,048.62
- October 9, 2002: Dropped to 1,114.11
- Hasn't surpassed the 3,000 mark since.
- Many tech/Internet stocks believed to be overvalued in early 2000. Key Question: How could the market make such significant oversights?
- Not backed by performance, price will crash
Real-World Bubbles – The Tech/Internet Bubble
- Tech and Internet stocks had notably high valuations in the late 1990s.
- By early 2000, U.S. stock market's level was believed to reflect investor irrationality.
- Robert Shiller provided evidence, describing the market's psychology as "irrational exuberance".
- The term "irrational exuberance" was first coined by Federal Reserve Chairman Alan Greenspan in a 1996 speech. Although markets momentarily dropped post-Greenspan's speech, they continued to rise and peaked in early 2000.
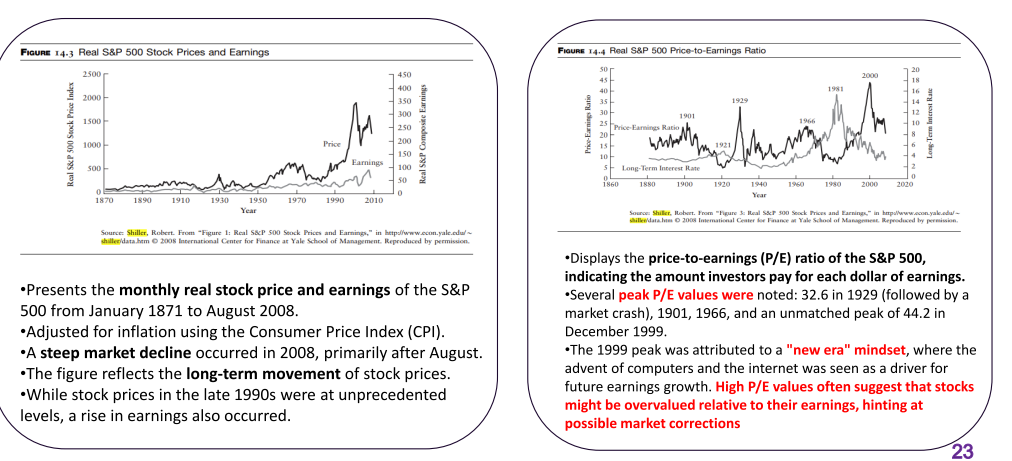
- High increase in 1990's
- Earnings also increased
- Can the earnings justify the increase in price?
- Every time there is a peak in P/E, followed by crash
- every $1, investors were willing to pay $44 (P/E 44)
- Could indicate growth expectation
- Too high, overvalued
- High increase in prices, earnings doesn't seem to back it up
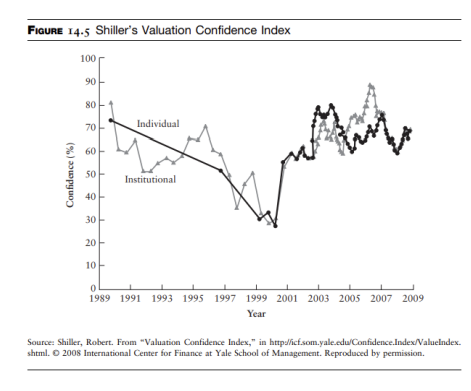
- Confidence among both individual and institutional investors declined leading up to 1999.
- At its lowest in 1999, only 31% of individual investors and 29% of institutional investors believed the market was fairly valued.
- This indicates that a vast majority (69% of individual and 71% of institutional investors) believed stock prices were overvalued in 1999.
- After the peak of stock prices in early 2000, confidence began to increase, returning to levels seen in the early 1990s.
- From 2003 to mid-2008, confidence levels remained relatively stable for both individual and institutional investors.
- The data suggests that during the late 1990s, many investors were wary of stock valuations, possibly with some purchasing in the hopes of offloading to someone else at a higher price, in line with the greater fool theory.
- less and less confident in the market
- Most people believed the market was overvalued
- price crashed in 2000
- Starting from 1990, was still increasing
- Think it is expensive, but you are hoping someone is a greater fool than you
- relating to herding behaviours
- follow, and dont think (herding behaviour) - FOMO
Real-World Bubbles – Tulip Mania

- Tulip Mania of the 1630s:
- Originated in Western Europe in the 16th century.
- Huge demand, especially in Holland and Germany.
- By the 1630s, specialised tulip markets emerged.
- Fortunes were made and lost quickly. Example: Trade of goods worth 2,500 florins for one tulip bulb.
- Interpretations:
- Greater Fool Theory: Buying overvalued assets hoping someone else will pay even more.
- Alternative View: Tulip bulbs, like art, might have had genuine value based on the preferences of the time. The bubble might reflect a sudden shift in preferences.
- Tulips a symbol status
- Demand and price increased
- Traded in exchange - for one bulb
- At one point cost 10x salary
- not buying for actual value - just using as investment
- Suddenly people didn't find it so interesting (shift of preferences), and the price plummeted
Experimental Bubbles
Experimental asset markets have provided new insights into how markets work.
- One of most perplexing findings from this research is tendency of prices to rise far above fundamental value and then later crash.
- First study to report bubbles in experimental asset markets was published in 1988.
Since then many studies have investigated factors that both mitigate and promote bubble formation. In a typical bubbles design, subjects trade an asset over a fixed number of periods.
- Asset has a common dividend that is earned on all units and determined at the end of a trading period using a known probability distribution.
If risk neutrality is assumed, we can easily compute fundamental value of asset by multiplying number of trading periods by expected dividend each period.
- Given risk aversion, correct value would be lower
- Risk neutral - expected dividends to calculate stock price
- Investor are risk averse, logically should be lower than true value
Dividends and Value
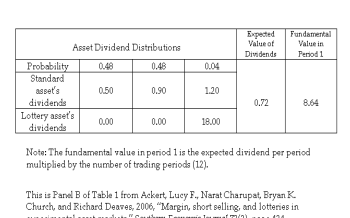
Focus on standard asset, leaving lottery asset for later.
- Asset trades for twelve five-minute periods so if you buy one unit in period 1 and hold it until the end of the experiment (i.e., 12 periods), you would earn twelve dividends.
Expected value of dividend each period is sum of probability-weighted possible dividends:
0.480.50 + .0480.90 + 0.04*1.20 = $0.72
- What is asset worth?
- If you are risk neutral: 0.72 * 12 = $8.64
- Fundamental values in all subsequent periods can be computed just as easily by multiplying the number of periods remaining times the expected value of $0.72
Typical Price Paths
- Typical price pattern in bubbles markets is different from what one would expect.
- Solid line indicates fundamental value each period, beginning at $8.64 in period 1 and falling by $0.72 each period.
- Dashed lines show median transactions prices per period for four different bubbles markets.
- All exhibited a bubble creation
- All above fundamental true value
- Even in 11th period, still higher than fundamental
What happened?
- Usually, price in period 1 is below fundamental value but quickly rises high above this point
- Price in first period may be low due to subjects’ initial risk aversion because they are trading in an environment in which they are inexperienced
- Some of bubbles in this figure are quite persistent -- but all eventually crash back to fundamental value as remaining trading periods become small
- Emotions heavily influence how we made the decision
Lessons from Experimental Bubble Markets
Though experimental bubbles markets are simple and do not include all important features of a complex market (like NYSE), they teach us how real bubbles might be generated.
- Price bubbles are more moderate and disappear faster when traders are experienced.
- Potential for short-selling leads to bubble dissipation.
- In real life trading, a lot more factors at play
- People behave differently in real life setting
- Disappear faster if investors are more experienced
In some experiments, two assets are traded in order to investigate whether pricing differs across the
assets.
One study allowed trading of two assets: a standard asset and a “lottery” asset.
Second asset is referred to as lottery asset because its payoffs are similar to a lottery.
- Payoff usually zero, but 4% of the time asset earns large dividend payment of $18.00
Although standard and lottery assets have identical expected values, traders were willing to pay more for lottery asset.
- Suggests that traders may be subject to probability judgment error (overweighting small probabilities).
- Another possible explanation is that speculation or gambling plays into how people determine what they will pay to acquire an asset.
- Willing to pay more for lottery asset because they become more risk taking as trading heats up
- lottery, small probability and high amount
- For lottery stock, expected payout the same
- Tend to overweight small probabilities
- pay more for the stock
- Speculation and tendency
Excess Volatility Puzzle
It seems that often market movements are not obviously explained by new information.
- One study examined largest stock price movements and important news events to try to ascertain connections.
- First looked at major events and whether they induced major market movements. Example 1: Japanese bomb Pearl Harbor (Dec. 8, 1941).
- Market dropped dramatically (by 4.37%) Example 2: Johnson defeats Goldwater in presidential election (Nov. 4, 1964).
- Market hardly moves (down by 0.05%)
- Market movement only because of volatility
- Some cannot be explained - Japan bombed Pearl harbour caused the market to drop dramatically
- Large event, market should move
Market Moves vs. News?
- 50 biggest market moves of last 50 years matched against explanation in New York Times.
- On several days Times actually reported there was no apparent cause (e.g., Sept. 3, 1946).
- Many other times “cause” doesn’t seem important enough – doesn’t seem that there is really any new meaningful information.
- Suggests excess volatility…
- Driven by changes in market sentiment
- Excess volatility not driven by market sentiment
Shiller and Theory
- Shiller tackles excess volatility taking a theoretical approach.
- He showed that it is difficult to explain the historical volatility of stock returns…
- Assuming investors are rational and discount rates are constant:
- Existing volatility implies a great deal of variation in dividend growth rates – which is fine if these expectations are realised.
- Using constant growth model, he considered growth rate forecast changes needed to justify realized changes in stock prices.
- Given a constant discount rate these would be unreasonably high.
- Growth rate really high for
- Constant growth model
- r is constant, growth rate cannot sustain high growth rate forever
Prices vs. Rational Prices
Figure 14.7 contrasts the observed S&P 500 index (p) with the calculated rational stock price (p*), based on future dividends.
- Notably, actual stock prices display significant volatility, diverging often from the more stable p*.
- Despite dividends being predictable, stock prices show 5 to 13 times more volatility than rational expectations.
- This disparity poses the question: Why are stock prices so volatile when dividends are stable?
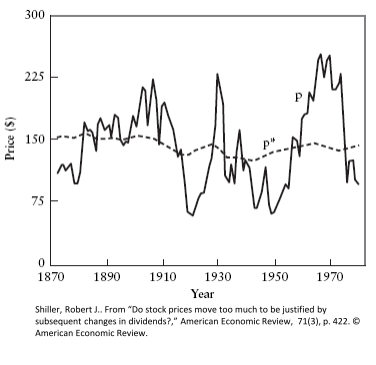
- dividends a quite sticky
- cut dividends, think the company is underperforming
- might not be able to increase dividends as can't sustain
- Price movement is constantly changing
- Stock prices are volatile while dividends are stable
Behavioural Explanation
Consider a stock. Investors think (wrongly) that dividend growth changes are permanent rather than transitory.
- For this reason, they overreact
- When they figure things out mean reversion sets in
- High returns are followed by low returns -- and vice versa
- Recency plays a role: recent high earnings growth makes people think that future growth is going to be higher than it actually turns out to be
A similar story can be told for overall market.
- reversal - overreaction causing the price to push up.
- Judgement error
- Recency bias, fixated on most recent changes to company
- Firm is going to perform better
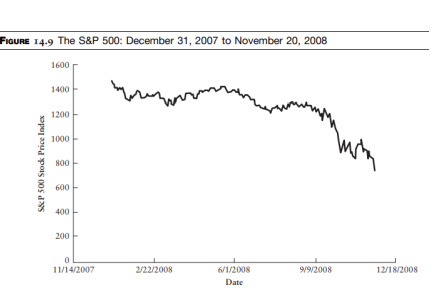
Market in 2008 - Key Events & Impacts
- Implication: Trillions of dollars in stock market value evaporated during this short time frame, signifying one of the most intense periods of market volatility and downturns.
- Market Reaction: Despite significant negative events in September 2008, the market remained stable during that week, potentially due to the anticipation of government intervention (like the bailout). However, the optimism was short-lived, and the market soon witnessed one of its most profound downturns. This interpretation summarizes the movement of the S&P 500 during a critical period of the 2007-2008 financial crisis, highlighting the market's extreme vulnerability and the rapid erosion of investor wealth.
Conclusion
- The equity premium is the difference between the expected returns on equity and debt. The high level of the premium is puzzling because it seems to require very high-risk aversion.
- Survivorship bias refers to the tendency to get biased results because failed observations are excluded from the sample over time. This may explain the equity premium.
- Loss aversion, combined with mental accounting and so-called myopic loss aversion, can explain why investors require a large premium on equity.
- A speculative bubble is present in a market when high prices seem to be generated more by traders’ enthusiasm than by economic fundamentals.
- Price bubbles are observed in diverse markets. For example, during the tulip mania, people traded large sums of money and goods for tulip bulbs.
- According to the greater fool theory, a person buys an asset because he believes another will pay even more to acquire it.
- In the 1990s, the entire U.S. market seems to have deviated far from valuations based on economic fundamentals. The technology sector was affected most dramatically.
- “Irrational exuberance” is a term used to describe the U.S. stock market by Federal Reserve Chairman Greenspan in the 1990s.
- Extremely high price-to-earnings ratios were explained by “new era” arguments
- Survey data indicate that a majority of individual and institutional investors thought the market was overvalued in 1999.
- In experimental bubbles markets, assets are traded over a fixed number of periods and traders can easily compute expected fundamental values.
- Prices in experiments typically bubble high above the fundamental value, crashing down as the end of trading approaches.
- Bubbles moderate when a subset of traders is knowledgeable and experienced, there is not too much cash in the market, and short sales are permitted.
- The generation of price bubbles is encouraged by probability judgment error and speculation.
- Stock prices are too volatile to be explained by future dividends.
- Volatility is higher for technology firms and the level of volatility is increasing, as is the difference in volatility across the S&P 500 and Nasdaq.
- The VIX, or fear index, gauges investors’ expectations of future stock market volatility using current option prices. In recent months, the VIX rose to unprecedented levels.
- Beginning in 2007, markets were gripped by a liquidity crisis. Potential contributing factors included the large risky positions taken by financial institutions, easy lending practices, and the perception that credit default risk was high.
- Three puzzles
- Equity premium puzzles
- Extreme risk aversion
- prospect theory, loss aversion and mental accounting
- bubbles
- greater fool theory
- Why irrational behaviours exist
- Excess of volatility
- Growth in earnings, recency bias
- Cause us to overreact to the news, causing price to fluctuate a lot.