Lecture 12
Behavioral Investing
Anomaly Attenuation
-
It has been argued that a number of anomalies, once reported in the academic literature, either attenuate or disappear in the future.
-
Anomaly dissipation is exactly what one would expect to see happen in a world which, while not always perfectly efficient, has a tendency to move in that direction once information is disseminated leading to remedial arbitrage activity.
-
But those anomalies that have been argued to be risk factors, in particular value and firm size, should not disappear…
- Because, under a risk story, they are not anomalies at all
- But rather fair compensation for risk borne
-
While value advantage did decline in late 90s, it did come back with a vengeance with bursting of tech/internet bubble beginning in 2000.
- All these anomalies are a public knowledge
- Once public, people can use this information - EMH, reflect public information
- Once published, effects weakened/disappeared
Doesn't mean an anomaly is persistent
Peer Group Evaluation
Becoming commonplace for managers to be evaluated relative to their size/value peer group -- relative to their style-peer group. Style is usually defined in terms of firm size and growth vs. value.
- Morningstar sorts funds into nine groups based on size/value 3 by 3 matrix
- Managers compared to other managers in their box
- To rise above crowd, one must do more!
- More common to evaluate manager's performance
- Categorise by firm value and size into matrix
- put funds into each cell of the matrix
- managers putting similar values into similar stocks are style peer group
- Have to do more than evaluate small and big cap firms
Style-Investing
Consideration of style in portfolio formation can mean different things:
- Given that style returns are cyclical, gains in risk reduction can be obtained by consciously diversifying over different styles
- Within this diversification approach, given that historically value has outperformed growth, and small-cap has outperformed large-cap, it may be advisable to tilt towards small-cap and value, while still investing in different styles
- If it is possible to predict when styles will be favored by investors, there may scope for style-rotation -- depending on what your predictive model is calling for
Still cyclical - don't always see small firms outperforming
- Encourage diversification
Style rotation - switching the style based on your short-term prediction
Style-Investing Example
Say a neutral value-growth allocation would be 50%/50%.
- If you consciously style-diversify, you would hold 50% in growth and 50% in value
- If you believe that value is more often than not better you might tilt 60% towards value (style tilting)
- If you believe you have a predictive model that allows you to time style returns, you might be willing to toggle back and forth, 80% or 40% in value (style rotation)
- value stocks generally outperform - invest more in value stocks - style tilting
- Style tilting is more speculation, tiled towards one direction more than another
- may allocate/toggle actively based on predictions is style rotation
Refining Value Investing by Using Accounting Data
- Research shows that value investing can be enhanced by conditioning on volatility and investor sophistication.
- Taking a different tack, Joseph Piotroski has shown that financial statement information can also be useful. It turns out that the effectiveness of value investing relies on a small number of firms — using a simple market-to-book approach.
Less than 44% of low market-to-book firms earned positive excess returns in the 2 years following portfolio formation. Developed a scoring system (F-Scores) on the level of financial soundness based on:
- Profitability
- Financial leverage/liquidity
- Operating efficiency
Rank the value stocks from 0 (least sound) to 9 (most sound). Zero-investment strategy of long (F>5) and short (F<5) earned 9.7%.
- Evaluating shares, come up with a better portfolio
- Looking at accounting data, enhance our value investing portfolio
- Created F scores of value firms
- Invest in high scoring stocks, earn 23% higher than those between 0 and 1
- Can enhance with public information
Refining Value Investing by Using Accounting Data
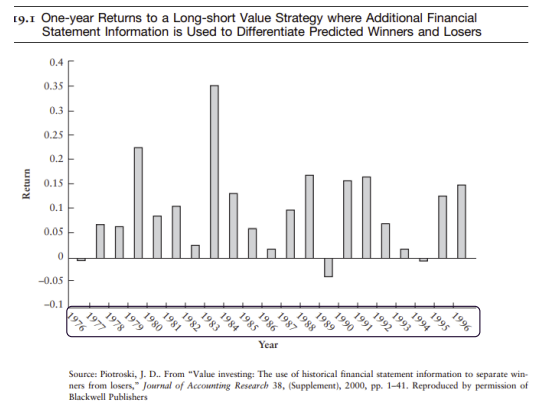
- Moreover, as shown in Figure 19.1, such a strategy proved quite dependable on a year- to-year basis.
- In only 3 of the 21 years of the sample does a long-short strategy earn negative risk- adjusted returns — and in two of these years the return is close to zero.
Refining Momentum-Investing Using Volume
Market State Impact: Momentum strength varies with market state. & Negative market states cause momentum dissipation.
- Volume as a Key Indicator:
Technical analysts regard volume as significant. Volume predicts the magnitude and persistence of momentum.
- Relationship Between Volume and Momentum: Documented by Charles Lee and Bhaskaran Swaminathan.
- Momentum returns tend to eventually reverse.
- Suggests momentum can be an overreaction.
- Momentum and reversal are interconnected.
Refining Momentum-Investing Using Volume
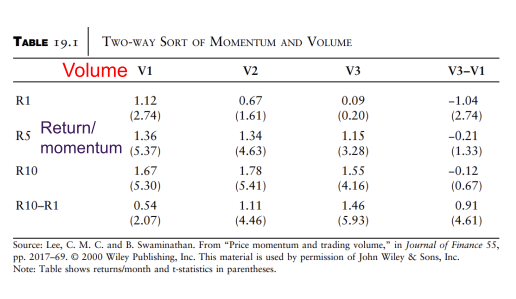
- Researchers divided firms into 10 past-return deciles and three volume terciles, forming 30 momentum-volume portfolios.
- They found that low volume-high momentum firms yielded higher returns at 1.67% per month
- while high volume-low momentum firms earned just 0.09% per month, creating a spread of 1.58% per month.
- low volume and high momentum - 1.67 excess return
- High volume low momentum - 0.09 excess return
- shorting and long on portfolio to receive excess returns
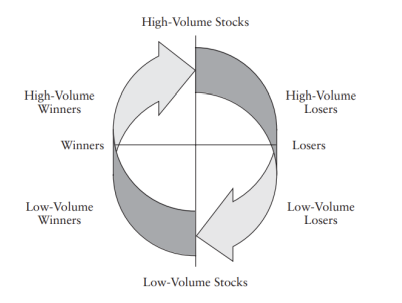
Momentum Life Cycle:
Stocks with good past returns and high-volume exhibit patterns. Stocks peak, face bad news, and get sold at high volume. As stocks decline, volume decreases. On stock recovery, volume starts low but eventually increases as the stock gains attention.
- understand momentum cycle
- Winning stocks with positive return, high volume stocks
- OR lots of strings of bad news, people selling stocks at a high volume
- High volume losers
- volume of stocks will dry up
Momentum and Reversal: Utilising Term Structure of Past Returns
- Mark Grinblatt and Tobias Moskowitz documented the gains available if one conditions on the entire term structure of past returns.
- As we have seen earlier, there is a negative serial correlation using both short-term (one-month) returns and long-term (3–5 year) returns, while positive serial correlation is present for medium-term (6–12 month) returns.
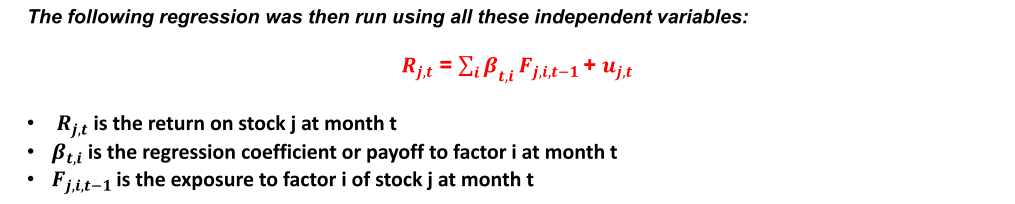
Researchers performed a regression of returns on:
- Past returns
- Differentiating between winners & losers
- And conditioning on consistency Then they formed deciles based on predicted returns from this regression.
Grinblatt-Han Model Summary:
- Focuses on capital gains overhang as the driver of future returns.
- Consistent winners likely to have larger unrealized capital gains.
- Stocks with similar past returns may differ in capital gains if achieved by occasional price jumps.
- negative serial correlation on short term - reversal
- The whole terms structures of past returns matters
- Different time horizons
- GH model, explained from disposition effect
- One of their focus was on unrealised capital gains
- Consistency of winning/losing matters
- the ones with consistent winning trends is more likely to have momentum
- The consistent winners have unrealised capital gains
- Experiment conducted
- separate out between winners (past winners) and losers
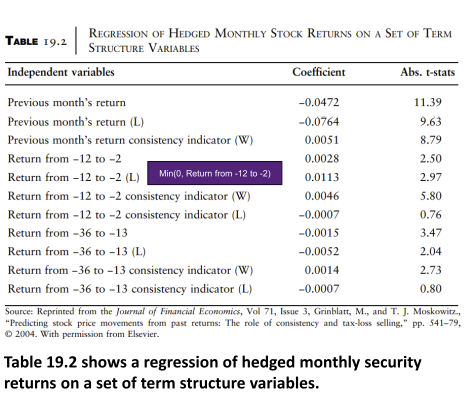
- Strong positive serial correlation observed in returns from 12 months back to one month.
- Greater persistence noticed for firms with negative returns in this span, indicating loser firms tend to remain losers.
- Consistency matters:
- Firms with positive returns in at least 8 of the 11 (from -12 to -2) months showcase enhanced momentum.
- Firms consistently performing negatively over 8 of the 11 (from -12 to -2) months don't affect momentum.
Momentum and Reversal
- Overall findings:
Losers show amplified serial correlations, consistent winners boost returns, while consistent losers don't influence momentum or reversal
- medium term, find positive momentum
- not just winners and losers, but medium term have positive correlations
- Past losers amplify the momentum
- Adding consistency
- consistent means 8/11 months
- significant result, boost return with winning stocks
- amplify serial correlation
- consistent losers don't necessarily show momentum
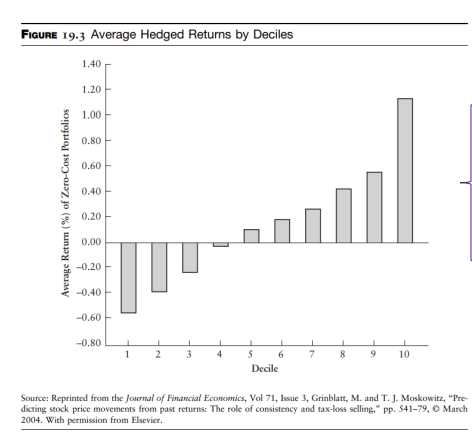
- Notice that they line up in order, with decile 10 earning the highest average returns and decile 1 earning the lowest.
- The decile 10 versus decile 1 gap is an impressive (and highly significant) 1.68%/month.
- Indeed, conditioning on the term structure of past returns seems a wise strategy.
This is of course what technical analysts have always done, though likely not with the same statistical rigor.
- Predicted the expected return, based their efficients in previous figure
- predicted expected return based on regressions
Momentum and Value
Clifford Asness studied the effects of simultaneous value and momentum screening on U.S. stocks.
- Stocks sorted into value and momentum quintiles resulted in 25 intersection portfolios.
- High momentum-high value portfolio averaged returns of 1.62%/month.
- Simultaneous use of value and momentum is not maximally effective because:
- Value best suits low-momentum stocks.
- Momentum most effective for low-value stocks.
- Low-value stocks showed a momentum differential of 1.47%.
- momentum improves performance, and value improves performance
- high-value high-momentum
- by combining the two strategies, should add even more value
- Looking at value, works best for low momentum
- Stocks are predicted to be undervalued
- If it really is undervalued, can earn further return
- momentum also works best for growth stocks - unrealised capital gains
- Value and momentum strategies works well for growth stocks
Multivariate Approaches
- Objective: Expand research beyond two factors using a multivariate approach.
- Study by Marc Reinganum:
- Analysed 222 firms with stock prices that doubled between 1970 and 1983.
- Goal: Identify shared characteristics of these "winners."
- Primary Question: Can these characteristics be used to develop a successful trading strategy?
Conditioning on a large number of variables
- Now a large number of conditioning variables used.
- Variables grouped into five categories: 1/risk; 2/liquidity; 3/price level; 4/growth potential; and 5/technical.
- Risk factors include such standard risk factors as beta and sensitivities to macroeconomic variables
- Illiquid stocks need to have higher returns to compensate traders who must face higher transaction costs, so such logical factors as price per share and volume were included
- Price level factors essentially capture value strategies, as this category includes share price relative to various accounting magnitudes
- Growth potential factors point to the likelihood of higher growth in earnings and dividends, with various profitability measures being used as proxies in this regard
- Idea here is that, for a given price relative to accounting measures, indicators suggesting higher future growth might point to diamonds in the rough
- Technical factors include standard momentum and reversal measures
- Reinganum's study (1970-1983) on AMEX and NYSE firms used specific commonalities to screen stocks. When all characteristics aligned, a buy signal was triggered, and stocks were held for two years, outperforming the S&P 500 by 37.14% at a comparable risk.
- Later, Haugen and Baker categorised numerous predictive factors into five groups: risk, liquidity, price level, growth potential, and technical. These factors encompassed elements like beta, stock liquidity, value strategies, earnings growth potential, and momentum indicators, aiming to enhance stock selection and investment strategy.
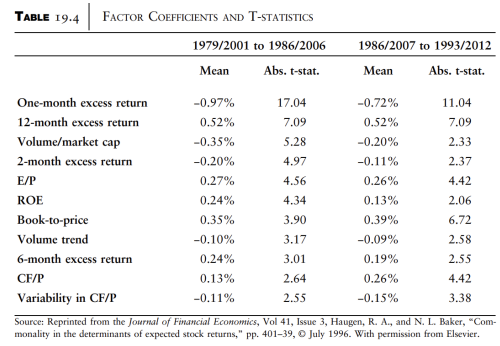
- The table displays coefficients representing the change in a stock's monthly expected return due to a one standard deviation change in exposure to a factor.
- Robustness checked by repeating the analysis for the latter half of the sample.
- Key observations:
- Factors' impact is consistent.
- No risk measures are present.
- Dominant factors are technical, price level, and liquidity.
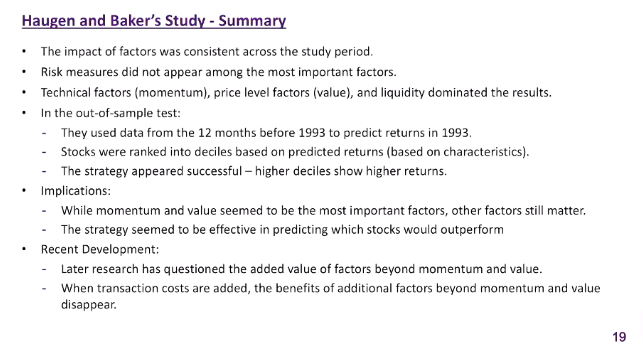
- perform out of sample test
- used prior data and characteristics to predict future data
- besides momentum and value, do other factors matter?
Style Rotation
- The act of moving from style to style in the attempt to time aggregate style preference shifts.
Predictive Models & Investment Strategies
- Necessity: Reliable predictive models are foundational for investment approaches.
- Key Macroeconomic Factors:
- Default premium
- Term structure slope
- Aggregate dividend yield
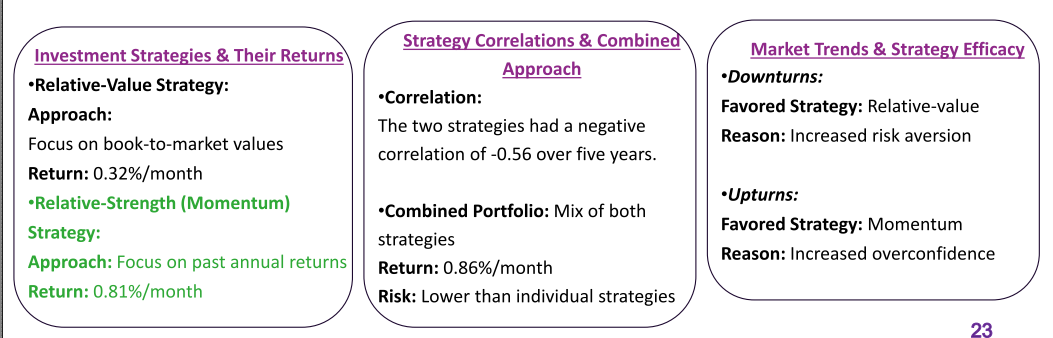
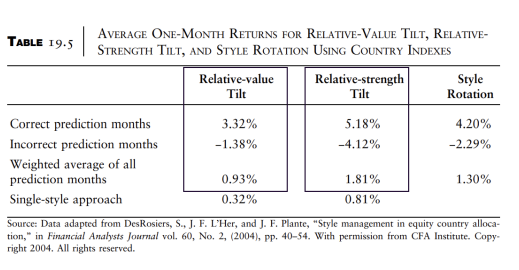
Style Rotation‘s Value:
Table 19.5 highlights the effectiveness of style rotation. For a relative-value tilt, although it's successful in 100 of the 203 months, the weighted average is a notable 0.93%/month. This is due to a stark difference between gains in successful months (3.32%) versus losses in unsuccessful ones (-1.38%).
Relative-Strength Returns: Signals favoring a relative-strength tilt succeeded in 90 out of 141 months. High gains during successful months (5.18%) against losses during failures (-4.12%) resulted in an impressive weighted return of 1.81%.
Conclusion: Style rotation averages 1.30%/month. Diversifying styles is beneficial, but prior year returns-based style rotation optimizes gains.
- engaging in style rotation, can earn excess return
- Diversifying in terms of styles is beneficial
- Style rotations will work
What is Behavioural Investing?
Anomalies are common knowledge -- having been published in many of the best journals. Anomaly capture in portfolio construction, while behavioral, is insufficient:
- Distinction should be made between what is behavioral (perhaps having continuity) and what is not (perhaps indicating statistical artifact)
One of the main determinants of whether a pattern in data has usefulness for the future is whether or not it is behaviourally based.
- Such anomalies are in some sense “natural”
- While they can potentially be arbitraged away, given the limits to arbitrage and human nature, this is not necessarily easy to do
- Not mentioning about different behavioural factors
- due to other things like statistical error
- Traditional finance says eveyone should be rational, etc.
- Behavioural finance tries to find an explanation as to try an explain it
- Try to apply it in strategies, how do you know whether it is behavioural investing?
- Might be due to behavioural favours
- Anomolous factors should become natural
- Limits to arbitrage and human factors means it is difficult to get rid of behaviour
- Overview: Study evaluated 16 behavioral mutual funds (self-proclaimed or media-identified ) claiming strategies based on behavioral finance principles.
- Limitations:
- Small sample size.
- Uncertainty if behavioral investing genuinely followed.
- Funds may change names/strategies to attract investments.
-
Findings:
- Behavioral funds attract investors mainly due to outperforming the S&P 500.
- Using Fama-French three-factor model with momentum, these funds don't show excess returns; they capitalise mainly on the value advantage.
-
Conclusion:
- No strong evidence that behavioral investing has significant benefits.
- Issues with sample size and statistical test power; funds might provide value, but it's challenging to conclusively determine.
- Are attacting investors, do outperform S&P 500
- all just capitalising on value advantage - not that behavioural/behaviourally driven
- Does not provide strong evidence
Is It Possible To Enhance Portfolio Performance Using Behavioural Finance Behavioural investing aims to enhance portfolio performance using behavioural finance insights.
- What It Isn’t: Merely naming a fund as "behavioural" or mentioning behavioural principles in a prospectus isn't enough.
- True Behavioral Investing: Utilizing known anomalies from behavioural models. Essential to discern which patterns will persist in the future. Preference for genuinely behaviorally based factors, e.g., the value advantage.
- Is It Effective? Despite mixed evidence, the distinction between true behavioural patterns and spurious ones is crucial. The verdict on behavioural investing's efficacy remains open due to current evidence limitations.
- Does not make your funds behavioural
- Don't know whether we can enhance portfolio or not
- Don't know if it provides the same results in the future
- Hard to say whether we can apply these models into the future