Lecture 3, Revised
[Part One – Efficient Market Hypothesis]
- 1 Overview about Efficient Market Hypothesis
- 1.1 Theoretical foundations and assumptions
[Part Two – Challenges to Market Efficiency]
- 2.1 Rationales supporting efficient market hypothesis
- 2.2 Theoretical challenges and Empirical challenges
Traditional Finance vs. Behavioral Finance
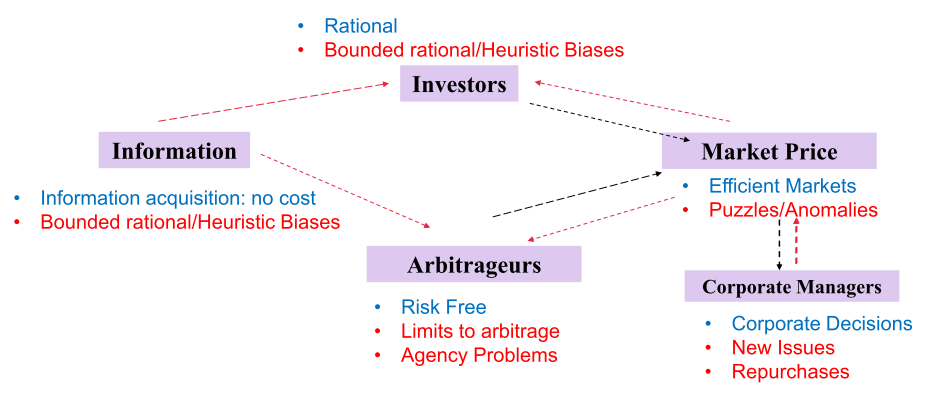
- Red, behavioural perspective
- blue, traditional finance
1. Efficient Market Hypothesis Overview
Only new information will move stock prices and this information is equally likely to be good news or bad news
The competition for information makes the capital market informationally efficient.
- The market processes information quickly and efficiently
- Prices reflect the information in the market.
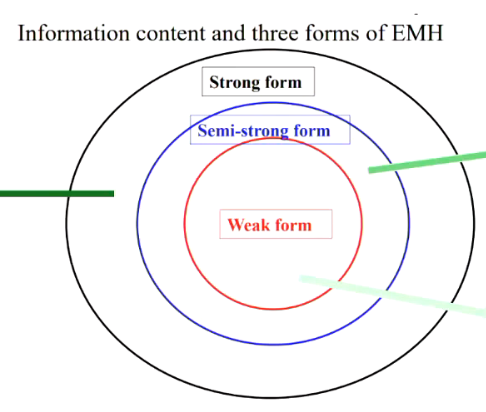
- Market efficiency can be categorised:
- The weak form asserts that all information to be derived from past stock prices and trading volume is already reflected in stock prices.
- The semi-strong form claims that all publicly available information is already reflected.
- The strong form, which generally is acknowledged to be extreme, asserts that all information, including insider information, is reflected in prices.
No answer of what form we are at
- market should incorporate all information already
Are markets Efficient? Semi-strong form and PEAD
But investors underreact to news, e.g., post earnings announcement drift (PEAD).
- The evidence is against semi-strong form efficiency
- i.e., Prices do not incorporate all public information quickly enough
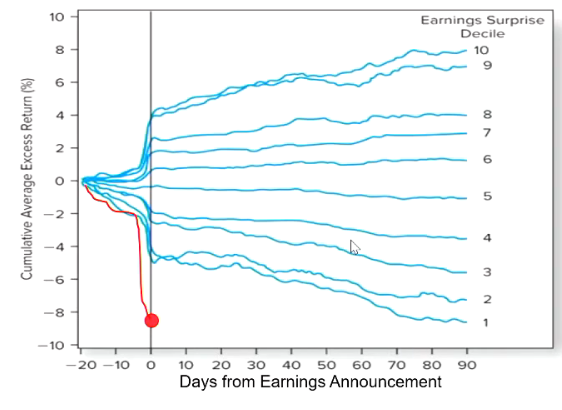
days from when earnings are announced
- effects continue 90 days after announcement
- short position, that price will continue to drop
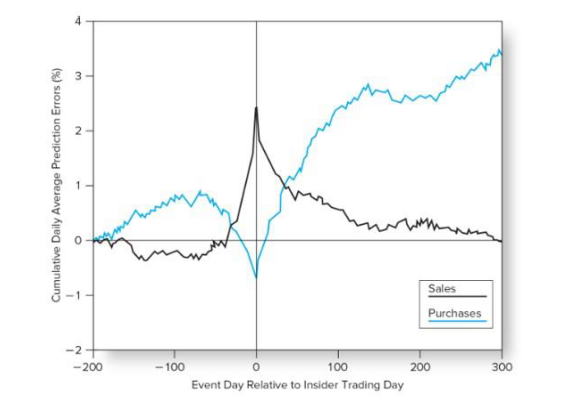
Are markets Efficient? Strong form
- Do stock prices fully reflect all information including information known only to insiders (directors, management)?
- If insiders can freely trade on their inside information then we might expect their trading to move price to where it reflects that information
Some studies have found insiders time their purchases and sales very profitably on average.
- Technical analysis: focuses on stock price patterns and on proxies for buy or sell pressure in the market.
- Fundamental analysis: focuses on the determinants of the underlying value of the firm, such as current profitability and growth prospects.
- Because both types of analysis are based on public information, neither should generate excess profits if markets are operating efficiently. That is, either technical analysis or fundamental analysis is not useful in predicting security price movements.
Proponents of the efficient market hypothesis often advocate passive as opposed to active investment strategies.
- The policy of passive investors is to buy and hold a broad-based market index.
They expend resources neither on market research nor on frequent purchase and sale of stocks.
That is, investors would be better off buying and holding an index fund or exchange traded funds (ETFs) than attempting to buy and sell individual securities or actively managed mutual funds. Examples: Track fund (2800) and H-share fund (2828)
- Fundamental analysis, DDM, DCF
- According to EMH, neither of these method should be useful
Random Walk vs Efficient Market Hypothesis
- Burton Malkiel: Yes, Random walk ➔ Efficient market hypothesis
- Richard Thaler says: No, Random walk Efficient market hypothesis
- (1) Prices generated by noise traders could be random but could be deviated from the fundamental value.
- (2) A drunk person walks on the street ➔ random walk, but not efficient.
- Alternative interpretation (Richard Thaler)
- (1) Prices are right (EMH) ➔ No free lunch (no arbitrage opportunity)
- (2) No free lunch Prices are right (EMH)
Malkiel:
- Because the market is following a random walk, active management will not add any value whatsoever
- Even professional fund managers cannot beat the market - and they should be the most informed investors
Richard Thaler
- Might have random walk, but does that automatically mean it is efficient?
- Random walk does efficiency
- trading based on noise, and not on information
- large enough group of noise traders can form a sentiment and can influence the market
“Prices are right” vs. “No free lunch”
Ross (2001) and Rubinstein (2001) point to the inability of professional money managers to beat the market as strong evidence of market efficiency. (Do you agree?)
- Barberis and Thaler (2003) argue that this statement is equivalent to the assumption that “no free lunch” implies “prices are right.”
- However, the performance of fund managers tells little about whether prices reflect fundamental value
- professional managers cannot beat the market, suggesting that there is not arbitrage profits to be made
- this must mean the price is correct
Which is more important - 'prices are right' or 'no free lunches'?
- From efficient capital allocation point of view, 'prices are right' is more important
- Just because we have a random walk, does not mean EMH is true
1.2 Efficient Market Hypothesis: Theoretical Foundations
- Investors are rational and they value securities rationally. (=> rational trades)
- Rationality implies efficient market hypothesis.
- However, EMH does not absolutely require rationality.
- Although some investors are irrational, if their trades are random, their irrational trades cancel out each other without affecting prices. (=> irrational random trades)
- EMH does not even require noise traders’ uncorrelated actions. EMH depends on arbitrage (Fama, 1965 and Friedman, 1953).
Efficient Market Hypothesis: Assumptions
-
The argument underlying the EMH is that investors are smart:
- They buy any security that is a “good deal”
- They sell any security that is “overpriced”
-
Competition between investors ensures securities are properly priced.
-
Key assumptions:
- Investors can access to and have the ability to process information
- Investors are rational (rational expectations and expected utility maximization)
- There is no limit of arbitrage
2.1 Rationales Supporting Efficiency
Fama (1998): Two reasons
- Anomalies are chance results
- Apparent overreaction to information is about as common as underreaction.
- Post-event continuation of pre-event abnormal returns is about as frequent as post-event reversal.
- Apparent anomalies can be due to methodology (more serious)
- A joint test: Fama (1970) emphasizes that market efficiency must be tested jointly with a model for expected (normal) returns. (we covered in Lecture One).
- Bad-model problems
- Any asset pricing model is just a model and so does not describe expected returns (wrong model)
- Even if there were a true model, any sample period can produce systematic deviations from model’s predictions. (I.e., there are chances for sample-specific patterns). Example: CAPM does not seem to describe expected returns on small stocks (sample specific)
- To limit bad-model problems, one can use the market model or the comparison model approach (how to remedy)
- The bad-model problem is less serious in event studies on short return windows. Bad-model errors in expected returns grow faster with the return horizon than the volatility of returns (short term: less a problem)
- The return metric issues
- Theoretical issue: Average “monthly” abnormal returns (AARs or CARs) vs. buy-and-hold abnormal returns
- Statistical issues: each method has its own drawback
- Equal-weight returns vs. value-weight returns
- Adjusted vs. unadjusted cross-sectional correlation
- Most long-term anomalies tend to disappear with reasonable changes in technique
methodology, i.e. using CAPM, DCF, etc.
- Other reasons
- Behavioral models are specific: Barberis, Shleifer, and Vishny (1998), Daniel, Hirshleifer, and Subrahmanyan (1997), and
Hong and Stein (1998):
- Work well on the anomalies they are designed to explain (short-term underreaction and long-term overreaction)
- Other anomalies are embarrassing.
- Data mining (Lo and MacKinlay (1990))
- If a sufficient number of variables are correlated, some correlations will be statistically significantly different from zero. I.e., if we search enough, we can always find some anomaly in historical data.
- Repeated visits to the same data set
- Long term data are not more persuasive
- Misinterpretation of size effect (Berk (1995))
- Operational size (such as total assets or sales) is unrelated to expected returns, but size is related to average return
- Size is likely to proxy for omitted or misestimated risk
- Econometric estimation limitations
- Sensitive to index inefficiency
- Anomalies depend on econometric power
- Attribute sorting problem (Ferson, 1996, 1998) - May create the illusion of false risk factors
Key trading rules that have shown to be effective
-
Small cap portfolios vs. large cap portfolios?
- Small cap wins out!
-
Portfolios formed based on P/Es:
- Low P/Es do better!
-
Earnings announcements momentum:
- Reaction to extreme announcements is slow!
-
Value vs. growth portfolios (usually value firm has a high book/market and a growth firm here is one with an absence of value):
- Go for value!
-
Predictable serial correlation:
- Medium-term momentum!
-
Long-term winners vs. losers:
- Reversals: losers become winners!
Value vs. growth portfolios: International evidence
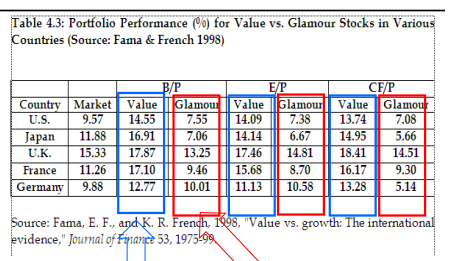
- In Table 4.3, the returns from various value investing (value stocks vs. glamour/growth stock) approaches (that is, using different price ratios as screens) are shown for the United States, Japan, the United Kingdom, France, and Germany during 1975–1995.1
- We see that in all 15 cases value stocks outperformed glamour stocks, where value/glamour portfolios were formed within each country by forming portfolios from the top/bottom 30% of stocks for each year on the basis of beginning-of-year B/P, E/P, and CF/P.
- Value stocks outperform glamour stocks
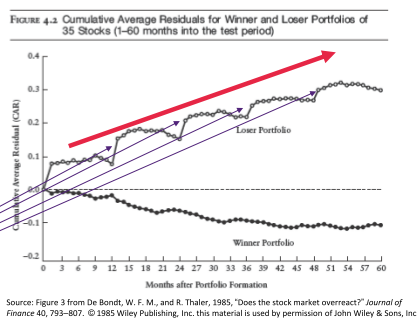
Reversal evidence
Figure 4.2, based on five-year formation periods and future returns being tracked five years out, indicates that there are substantial differences. The difference between winners and losers is stark, with past losers substantially outperforming past winners.
Also salient from the figure are two other points:
- much of the difference is generated by the strong performance of losers rather than the weak performance of winners;
- much of the return boost/drop occurs in the month of January
More of the loser stock
- decreasing of the winner stock
- Always an increase/jump, sell loser stocks and buy them back again
- Can't simply look at past and say market is efficient
Momentum evidence
Several years later, intermediate-term (3–12 month) momentum was documented by Narasimhan Jegadeesh and Sheridan Titman. Their approach was similar to that of De Bondt and Thaler except that their return intervals were shorter. Table 4.4 reproduces some key results from their paper.
They found, for example, that a long-short zero-cost portfolio formed on the basis of returns over the previous six months earned an average excess return of 0.95% per month over the next six months.
Also, there is a relationship between post-earnings announcement drift and momentum—though whether momentum disappears after accounting for post-earnings announcement drift is a point of debate.
- See the firms winning, will win in the long term
- follows a momentum
- Can chase (invest) the momentum
- Capture the profits
- 0.95% Excess return per month
2.2 Theoretical challenges and Empirical challenges of Efficient markets
Market efficiency requires that only one of the following three conditions need hold:
- Universal rationality
- Uncorrelated errors
- Unlimited arbitrage
- One of main foundations of EMH is no-arbitrage condition.
- If there are pricing errors (e.g., caused by irrational investors) smart-money traders arbitrage them away.
- No free lunches are left on the table!
Triangular Arbitrage
Cross rates can be used to check on opportunities for intermarket arbitrage.
Suppose the following exchange rates are available:
- Barclays Bank: Australian dollars per pound sterling:
- Westpac Bank: Australian dollars per Euro:
- Deutsche Bank: Euro per pound sterling: (market)
The synthetic cross-rate between Euro and pound is:
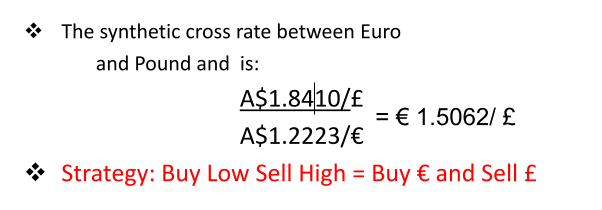
However, when a mispricing occurs, strategies designed to correct can be riskyand costly, thereby allowing the mispricing to survive for a long time.
What hampers arbitrage exploitation?
1) Fundamental Risk
- If you think a stock is underpriced you can buy it, but:
- You might be sideswiped by the market.
- Or maybe by the industry.
- Plus, there is idiosyncratic risk.
- Pure arbitrage seeks to eliminate all of these.
- Problem: you need to find perfect substitutes. Or we can say it is the risk when a perfect substitute is not available.
Sentiment and noise
- Noise is opinion on value unrelated to fundamental information (i.e., based on misinformation)
- Sentiment is correlated noise, and has the potential power to move markets.
- This implies that price movements can be driven by misinformation rather than information.
- Noise traders can influence the prices.
- Noise traders can earn more profits than arbitrageurs, when they are are bullish and are willing to take more risk, they create.
- Noise traders may not be driven out of the market.
- However, arbitragers have higher expected utility, while noise traders have lower expected utility
2) Noise Trader risk
The idea is introduced by De Long et al. (1991) and Shleifer and Vishny (1997). (Noise trader risk is the risk that mispricing being exploited by the arbitrageurs worsen in the short run)
- It has been shown that noise-trader risk is systematic, which means that it cannot be diversified away.
- Real world arbitrageurs cannot wait it out because as professional money managers they do not have long horizons – they are usually evaluated at least at once per year.
- If it becomes sentiment, has potential power to move market
- If we have large enough former sentiment, can move the market
- Noise traders can influence the market as well
- Biggest and bullish enough, can be profitable
==> Three issues:
- (1) Principal – Agent Problems (Horizon Mismatch Risk)
- (2) Creditor Risk (Margin Risk)
- (3) Short Squeeze Risk
3) Implementation costs
- In some cases, horizon is short but short-selling is:
- Expensive (commissions, spreads, price impact & fees for shorting stock)
- Difficult or even impossible (lack of availability regardless of fees; legal factors: many institutions cannot short) Plus there is cost of finding these arbitrage opportunities.
- Transaction costs: commissions, bid-ask spreads and price impact can make it less attractive to exploit a mispricing.
- Legal constraints: many pension and mutual fund managers are not allowed for short sales.
- Other costs: the cost of finding and learning about a mispricing and the cost of the resource needed to exploit it.
3Com/Plam explanation
- “Smart” investors were limited in their ability to short-sell Palm (as documented in Lamont and Thaler), so it wasn’t their fault.
- But this cannot explain why anybody would buy Palm instead of 3Com – for this one needs irrationality.
- In facts 2 things are needed for mispricing to exist:
- Irrational investors
- Limits to arbitrage (here due to implementation costs)
- 3Com & Palm case illustrates that mispricing does not imply a free lunch!