Lecture 8
Heuristics/Biases and Implications
[Part One – Application of Heuristics and Biases]
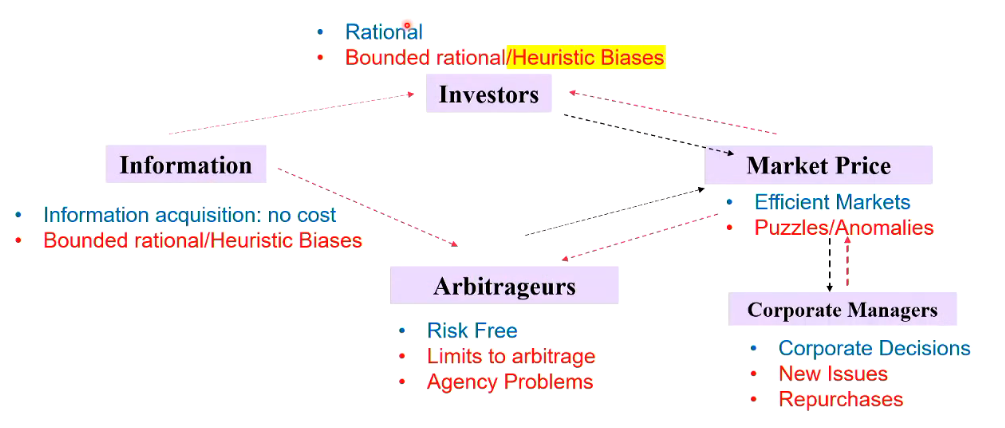
- Rational assumptions
- Prospect theory - do not act as a rational investor (Heuristic Biases)
Perception and Processing Constraints
- Expectations influence perceptions.
- People see what they want to see.
- People experience cognitive dissonance when they simultaneously hold two thoughts which are psychologically inconsistent.
- Rely on heuristic
- normally a quick decision you have to make
- Tend to see what you want to see
Hold two conflicting ideas at the same time
- Think good things about themselves
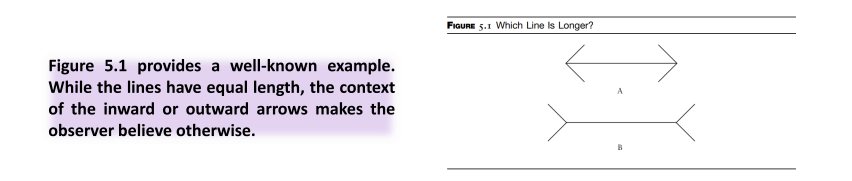
Perception and the Frame
Perception is not just seeing what’s there – but it is influenced by the frame:
- E.g. How tall is that person? Vs. How short is that person?
- Halo effects: Someone who likes one outstanding attribute of an individual likes everything about the individual
- Primacy vs. Recency effects
- Halo - everything you think about is great
- Primacy - normally you think about the 'first' thing
- based on most recent event
Uncertainty effects human behaviour
Memory Tricks
Memory is not a simple matter of information retrieval:
- It is reconstructive
- In an experimental context, when people witness an event and receive misleading information about it, this misinformation is often incorporated into their memory.
- It is variable in intensity…
- With emotion playing a role
- It is prone to self -serving distortion (hindsight bias)
- Since pleasant memories make you happier than unpleasant ones, it is not surprising that we are sometimes prone to “rewriting history.” It also makes us feel better to think we have more control over events than we really do, or that we have a good sense of what is likely to happen in the future. The corollary to this is that in the past we also must have had a pretty good sense of what was likely to transpire. In other words, “we knew it all along.”
Memory is emotional - mark memories
- Memory can trick you (might look or feel better)
- Keep accumulating all these things
- Change your financial decisions depending on how it affects your memory
Heuristics
In many cases, delay is not feasible. Decisions need to be made, even if the environment is one of limited attention, information, and processing capacity, so shortcuts, or heuristics, are necessary.
- Heuristics or rules-of-thumb: decision-making shortcuts.
- Necessary because the world, being a complicated place, must be simplified in order to allow decisions to be made.
- Heuristics often make sense but falter when used outside of their natural domain.
Brain 'rule of thumb'
- Mainly focus on negative drawback
Type 1 & 2 Heuristics
Heuristics come in all shapes and sizes. One dichotomy is between those heuristics that are reflexive, autonomic, and noncognitive, and economise on effort (Type 1); and others, which are cognitive in nature (Type 2).
- Type 1: Autonomic and non-cognitive, conserving on effort.
I choose a hamburger over a hot dog because I usually prefer them
- Used when very quick choice called for
- Or when it’s “no big deal”
- Type 2: Cognitive & requiring effort.
No, I will choose the hot dog today because it is prepared differently and I like to try new things
- Used when you have more time to ponder Type 2 can overrule Type 1.
- Type 1 is effortless
- too trivial, was to conserve your effort
- Choose randomly
- Type 2 requiring more effort
- Requires you to think a little bit more
- Make some sort of cost and benefit analysis
Example: Self-Preservation Heuristics
Hear a noise with an unknown source?
- Move away till you know more
Food tasting off?
- Stop eating it
These make good sense and are autonomic. Other heuristics, which are more cognitive, are related to comfort with the familiar.
Example: Diversification Heuristic
The diversification heuristic suggests that people like to try a little bit of everything when choices are not mutually exclusive.
- Observe people at a buffet.
- Many people are trying a bit of everything
- Nobody wants to miss out on something good
- Diversification sometimes comes naturally.
Example: Ambiguity Aversion
- In experiments, people are more willing to bet the colour of a ball drawn at random if they know the bag contains 50 red and 50 blue, than if they know a bag contains blue and red balls in unknown proportions.
- Lesson: people are more comfortable with risk vs. uncertainty (ambiguity).
Example: Endowment Effect
- What you currently have seems better than what you do not have.
- Experimental subjects valued something that they possessed (after it was given to them) more than they would have if they had to consciously go out and buy the item.
Example: Information Overload
- Experiment involving tasting jams and jellies in a supermarket.
- Treatment 1: Small selection.
- Treatment 2: Large selection.
- Which attracted more interest?
- Treatment 2.
- Which lead to more buying?
- Treatment 1.
- See a small selection of jams
- presented 20 selections vs 2, more likely to make selection with less
- better way to close a deal is to offer a small selection
Representativeness
- People judge probabilities “by the degree to which A is representative of B, that is, by the
degree to which A resembles B.”
- A can be a sample and B a population;
- A can be a person and B a group;
- A can be an event/effect and B a process/cause
- Behaviours associated with representativeness:
- Conjunction fallacy
- Base rate neglect/underweighting
- Hot hand
- Gambler’s fallacy
- Overestimating probability
Conjunction fallacy: Venn diagram
Which seems more likely? A. Jane is a lottery winner. B. Jane is a happy lottery winner.
Many pick B, but A must have a higher probability, as a Venn diagram clearly shows.
Problem: conjunction fallacy.
An example of people having difficulty with probabilities is when they have no notion of the difference between simple probabilities (probability of A) and joint probabilities (probability of both A and B).
For example, they naturally feel that the probability that they will win the lottery and be overjoyed the next day is higher than the probability that they will just win the lottery.

join probability, both of them happening at the same time
- Two separate events, joint probability will always be lower
Base Rate Neglect and Bayes’ Rule
An important variant of representativeness is base rate neglect.
- The tendency to ignore relevant statistical information in favour of case-specific information.
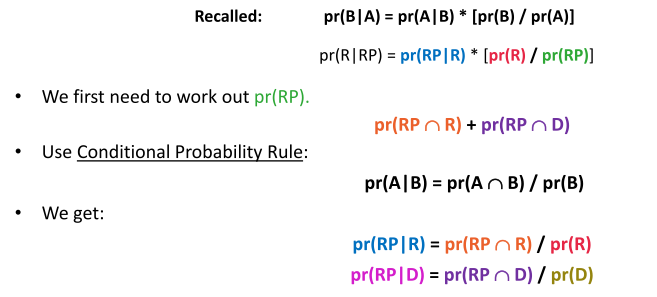
Bayes’ rule, a useful relationship that allows us to evaluate conditional probabilities:

It says that the probability of event B, conditional on event A, is equal to the probability of event A, conditional on event B, times the ratio of the simple probabilities (base rates) of event B to event A.
- Bayes’ rule allows one to optimally update estimated probability based on the new information (the condition).
- update the probability when you have new information coming in
- base rate, also called prior
- P(A|B) also called post
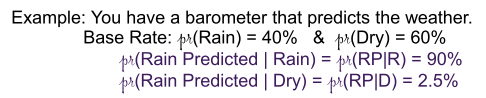
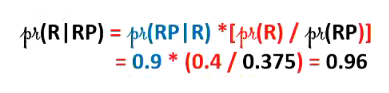
- Best prediction of tomorrow’s weather without looking at barometer is prior (base rate) distribution:
you would say 40% chance of rain.
- What should you predict when barometer predicts rain?
- That is, what is probability of rain (R) conditional on rain being predicted (RP)?
- new information - P(R) GIVEN rain is predicted
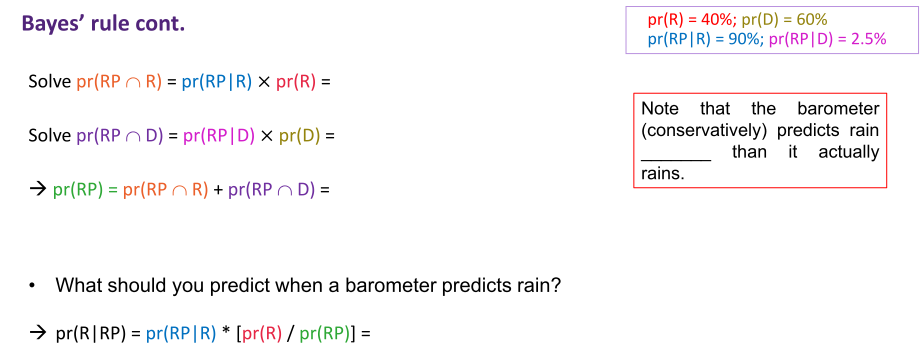
Base rate neglect would imply that you believe there is a _______________ chance of rain conditional on rain being predicted.
Hot Hand Phenomenon
- Sometimes people feel that distribution/population should look like sample,
- but sometimes they feel sample should look like distribution/population.
- Former is especially true if people aren’t sure about nature of distribution/population.
- As in hot hand phenomenon in sport:
- In basketball, it is erroneously thought that you should give ball to hot player
Gambler’s Fallacy
Gambler’s fallacy may apply if people are fairly sure about nature of population.
- They think even small samples should always look like population.
- So, if you flip a coin 9 times getting 6 heads and 3 tails, these people would say that a tail is more likely to come next.
- “We are due for tails.”
- Winning lottery numbers are avoided based on mistaken view that they are not likely to come up again for a while.
- Past event can influence future
- flip a coin 9 times and get all heads, believe the next flip will be heads also
Overestimating Predictability
- Tendency to underestimate regression to mean – amounts to exaggerating predictability.
- GPA example: subjects were asked to predict GPA in college from high school GPA of entrants to the college.
- High school average GPAs: 3.44 (sd = 0.36); GPA achieved at college was 3.08 (sd = 0.40).
- One student was chosen: high school GPA of 2.2; another with a high school GPA 3.8
- People underestimated the mean regression for this low-achiever.
- Probability of getting a 7 for another course
Biases related to representativeness
Recency:
- Recent evidence is more compelling. Salience:
- Dramatic evidence is more compelling. Availability:
- Freely available, easily processed information is more compelling.
Salience
- associate negative events with company
Availability
- how easy you can record information - if you can record easily you tend to overweight it
Anchoring
People are initially anchored on their prior beliefs. Quickly multiply these eight numbers:
- 1 * 2 * 3 * 4 * 5 * 6 * 7 * 8
Most people will come up with a low estimate: anchored on the product of the first 4 or 5.
- A bit better (but still too low) with:
- 8 * 7 * 6 * 5 * 4 * 3 * 2 * 1
- 'Anchor' on the first number
Example:
- Subjects were asked:
-
- Is the number of African nations in the UN more or less than wheel number?
-
- How many African nations are there in the UN?
-
- Answers were highly influenced by wheel:
- Median answer was 25 for those seeing 10 from wheel.
- Median answer was 45 for those seeing 65 from wheel.
- Grasping at straws!
- Just a random number
Anchoring vs. Representativeness
- Anchoring says new information is discounted.
- Representativeness (base rate neglect variety) says people are too influenced by latest information.
- Potential conflict between anchoring and representativeness in how people deal with new evidence.
Which is right?
- Perhaps both depending on situation…
Conflicting result - anchoring vs representativeness
- Anchor - tend to discount new information
Some situations tend to anchor more, some tend to rely on new information
Anchoring vs. Representativeness ii.
- It is argued that people are “coarsely calibrated.”
- Suppose morning forecast is for sun. Day starts sunny. You go on a picnic.
- Some dark clouds start to move in
- You are anchored to prior view and discount clouds
- More dark clouds: the same thing
Anchoring vs. representativeness iii.
- Even more dark clouds.
- Now you coarsely transition – thinking that “it’s going to rain for sure!”
- What is reality? Never 0% or 100%. New information should alter probabilities but a flip-flop doesn’t make sense. Coarse calibration has been used to explain tendency for prices to trend and eventually reverse.
[Part Two – Implications of Heuristics and Biases for Financial Decision-Making]
- Expectations influence perceptions:
- If most people are saying good/bad things about company, you will “find” good/bad things
- It has been argued that cognitive dissonance can:
- Explain why people don’t exit poorly-performing mutual funds
- Diversification heuristic
- Stock-bond menu influences risk taking in Defined Contribution plans
- Ambiguity aversion
- Under-diversification
- Information overload
- Lower participation rates for Defined Contribution plans with more investment choices
- Representativeness (and halo effects)
- “Good companies are good stocks” thinking may lead to value advantage
- Recency
- May explain chasing winners
- Anchoring and slow adjustment coupled with representativeness
- May explain momentum and price reversal
While heuristics are usually excellent time- and effort saving decision-making mechanisms, they sometimes appear to lead investors in unfortunate directions. we return to these heuristics when we investigate their potential impact on the behavior of investors, future retirees, analysts, and managers, and how they may potentially impact market outcomes.
Home Bias
Domestic investors hold mostly domestic securities.
- American investors hold mostly U.S. securities
- Japanese investors hold mostly Japanese securities.
- British investors hold mostly U.K. securities. In doing so, they forego gains from international diversification.
- Home bias - domestic (within a country)
- Tend to forgo international diversification
Investor international holdings
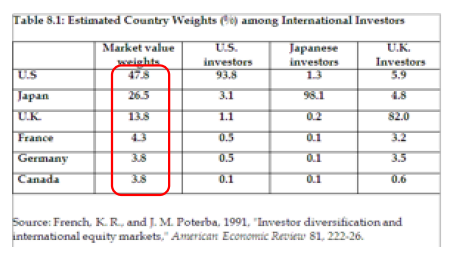
- Table 8.1 displays the aggregate market values of the six biggest stock markets in the world. The United States, as of 1989, had 47.8% of world market capitalisation, Japan 26.5%, the U.K. 13.8%, France 4.3%, Germany 3.8%, and Canada 3.8%.
- Nevertheless, a typical U.S. investor held 93.8% in U.S. stocks; a typical Japanese investor held 98.1% in Japanese stocks; and a typical U.K. investor held 82.0% in U.K. stocks. Thus, domestic investors overweight domestic stocks. This behaviour is called home bias.
- invest more in local holdings
Potential Home Bias Explanations
- Excessive optimism about the prospects of the domestic market.
- Comfort-seeking and familiarity.
- What is familiar is good (i.e., a good investment)
- Institutional restrictions:
- Capital movement restrictions
- Differential trading costs
- Differential tax rates
- Latter likely plays a very minor role.
Why?
- excessive optimisms in domestic market
- Easy to understand local market
- comfort and familiarity - can be a good thing
- A lot more information than the company overseas
- Withholding tax, more to deal with
Excessive domestic optimism would imply a lot of disagreement among investor groups
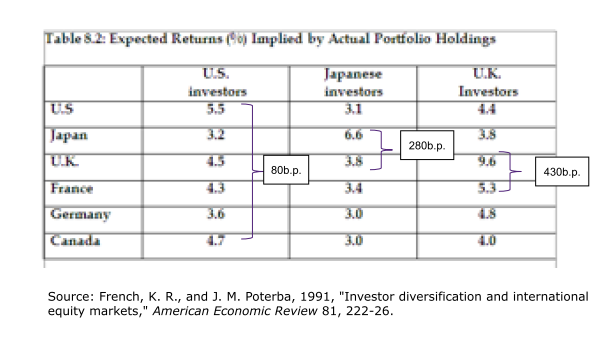
- Expected return implied by holding
- 80bp - best holding to next best holding
- is it possible to justify
Home Bias Within a Country
- Home bias seems to be driven by a comfort-level with the familiar.
- In 1984, AT&T was forced by the court into a divestiture whereby seven “Baby Bells” were created.
- Created along regional lines – example: Bellsouth serving southeastern United States.
- If people like familiarity, then we would expect that a disproportionate number of a Baby Bell’s customers to hold a disproportionate number of shares in the same Baby Bell.
- Exactly what happened after the divestiture.
- Tend to want to invest in something you are familiar with
- break it into divisions
- People tend to buy (hold onto the stock) that is close to their home
Poor Diversification is Implied
- From a diversification standpoint, if anything you are wise to underweight (not overweight) local companies.
- If you work and invest locally, technically speaking, your two income sources are highly correlated.
- Diversification theory says you should look for income streams that are weakly correlated.
- Better for investors to buy stock in Baby Bells outside their region.
- Job is tied to the company and investing in the same company
- not diversifying with job security
- Unless you have insider information, put more aid into company
Language
In Finland, there are two official languages, Finnish and Swedish.
- Annual reports are normally published in Finnish or in both official languages, but in a few cases, reports are only published in Swedish.
- Controlling for other relevant factors, Finnish investors prefer companies whose language of publication is Finnish.
- And Swedish investors prefer companies whose language is Swedish – with bilingual companies being mid-ranked.
Culture
- From the same study, culture matters as well.
- It was noted whether CEOs were Finnish or Swedish.
- Controlling for language of the company, Finnish speakers prefer Finnish CEOs.
- And Swedish speakers prefer Swedish CEOs.
- Financial analysis perspective
- numbers is the same,
Home Bias and Informational Advantage
A rational explanation for local preference is an informational advantage.
- Informational advantages various benefits gained from knowing more about local companies and thus having a more accurate view of value.
- You know more about what is close.
- Gains from being local to a company may appear in improved monitoring capability and access to private information.
- Prefer to invest in local company because you may know more about them
- have insight others may not have
Evidence from Mutual Fund Manager Behaviour
- Consistent with familiarity bias, managers tend to favour local firms.
- Average manager invests in companies that are 160-84 kilometres, or 9-11%, closer to her than the average firm she could have held.
- Local preference is related to firm size: tendency to invest locally stronger for smaller firms (where informational advantage is likely to be greater).
- Smaller firm tend to be more information disadvantaged
- Get more information from local small firm
Does Local Preference Boost Performance?
- Significant payoff to local preference.
- Fund managers on average earn 2.67%/year more on local investments.
- While local stocks avoided by managers underperform by 3%/year. And those better able to select local stocks tend to concentrate their holdings more locally.
- Tend to perform better
Can retail investors profit from local information?
- Evidence that retail investors also have some ability in this regard.
- Reminiscent of money manager finding, based on a dataset of retail investors, local investments outperformed remote investments by 3.2%/year.
Representativeness: “Good Companies are Good Investments”
- Seems obvious that if a company has high-quality management, a strong image and has enjoyed consistent growth in earnings, it must be a good investment.
- Students of finance of course know better.
- Positive qualities should already be embedded in price.
- Loosely speaking, good companies will already sell at high prices, and bad companies will already sell at low prices
- Good company doesn't necessarily mean good investment
- Does not mean you will make money
- Information embedded into stock price
But Do Executives Know Better?
- Fortune magazine has been surveying senior executives on company attributes for a number of years.
- Executives are asked to assign values between ‘0’ (poor) and ‘10’ (excellent) to each company in their industry for the following eight items:
- Quality of management
- Quality of products/services
- Innovativeness
- Long-term investment value
- Financial soundness
- Ability to attract, develop, and keep talented people
- Responsibility to the community and environment
- Wise use of corporate assets
- 82% of respondents consider the quality of management as the most important attribute of a company’s quality.
- quality of management as a proxy
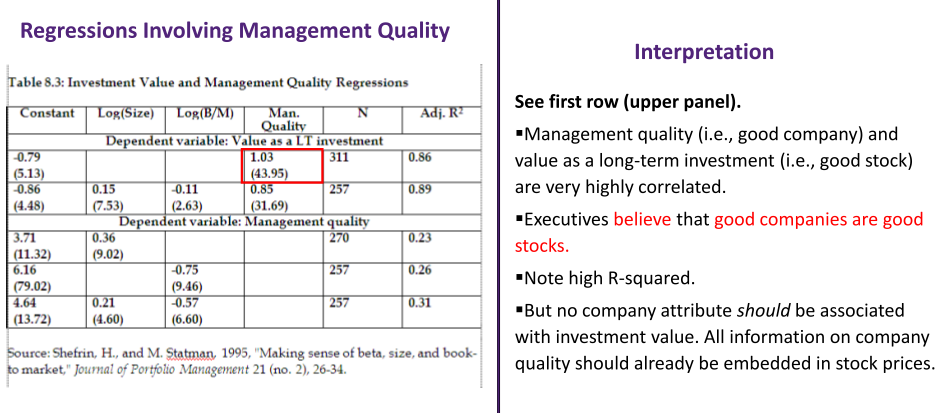
- No company attribute should be associated with investment value
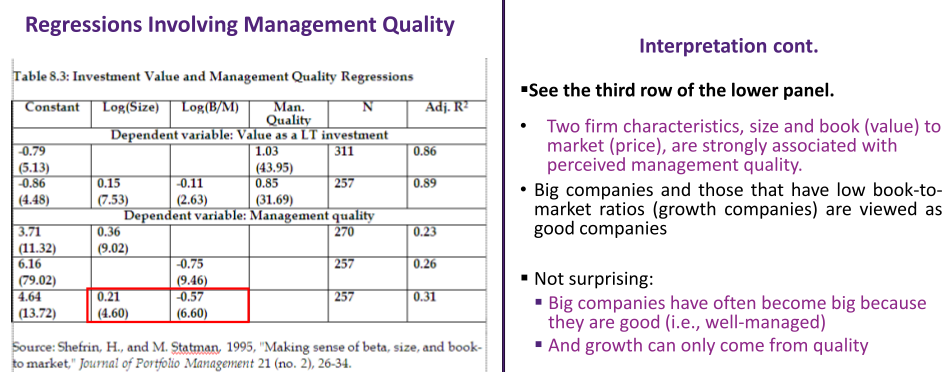
- Big firm tend to be a better firm, book to market
- Low book-to-market means a growth firm
- size and book to market
- effect investment decisions
- growth firm, tend to invest
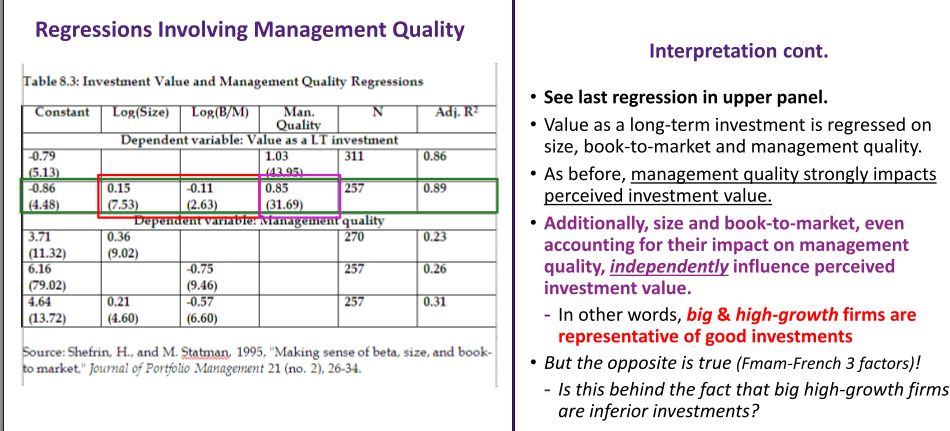
Small stock tend to perform better
- paying more for large and growth stock means small stock is cheaper
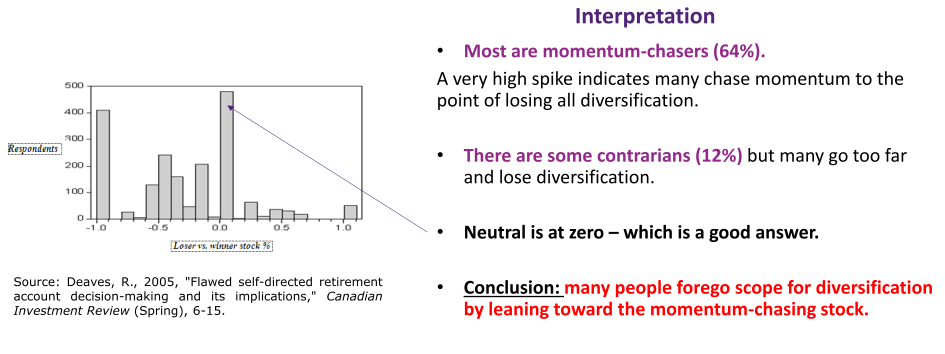
Momentum-Chasing: Survey Evidence
- Momentum-Chaser: Trend followers with the view that investment performance in the recent past represents future performance.
- Contrarian: Purposefully goes against the prevailing market trends. Survey of workers managing their own retirement money. Respondents were asked to start their pensions from scratch and allocate money between two stocks:
- One with an “average return over the last 5 years of 5%”
- And a second with an “average return over the last 5 years of 15%.”
- Further told that “analysts forecast that both stocks should earn about 10% per year over the next 5 years.”
Momentum-Chasing and Company Stock
In studying 401(k)s defined contribution plan members new allocations into company stock, Bernartzi (2001, JF) has established that much of it was from chasing winners. Forming portfolios based on 1-yr/10-yr own-company stock returns:
- Low-return portfolios had 21%/10% put into company stock
- High-return portfolios had 24%/40% put into company stock
Does chasing past returns make sense?
Academic evidence is somewhat subtle here:
- There is evidence of (a little) intermediate-term momentum (3-month to 1-year returns)
- But there is also evidence of reversals for longer-term returns (3-5-year returns)
- So best answer to the survey question is to be a slight contrarian – but one has to be careful not to surrender diversification
Absolutely fine to go 50/50 and maximise diversification.
- Do not overdo it, surrender diversification
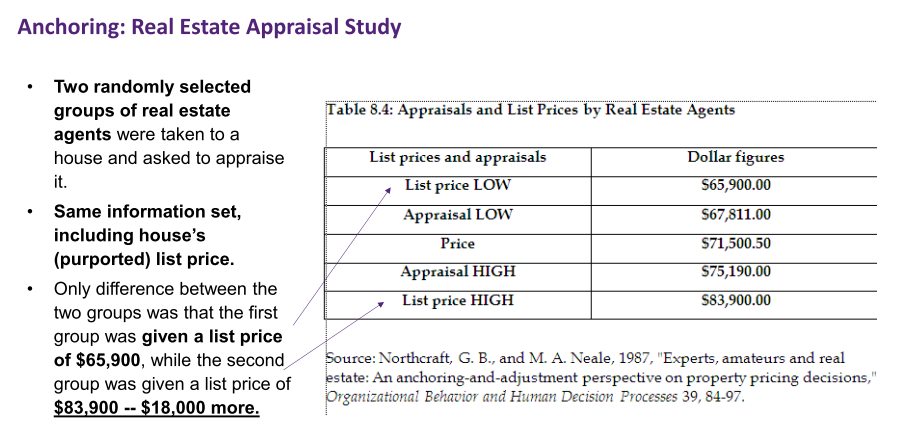
- The average appraisal price of the first group came in at $67,811.
- The average appraisal price of the second group was $75,190.
- If we take the mid-point of these values ($71,500.50) as our best estimate of the true appraisal value, the gaps between the two appraisal averages ($75,190 - $67,811) was a full 10%.
- Agents were anchored on list prices that they were exposed to – despite the fact that only 25% mentioned list price as one of the factors that they considered.
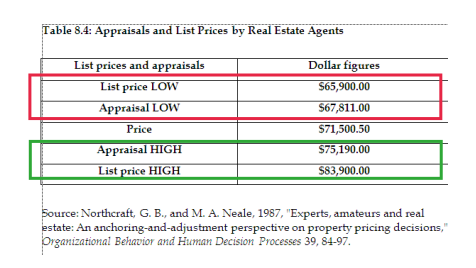
- High list price gets you a higher appaisal price
- most of them look at the listing price
Conclusion
- Investor’ deviations from maxims of economic rationality are highly persuasive andsystematic (Kahneman and Riepe (1998)): Irrationality
- Investors do not follow axioms of Von-Neuman Morgenstein expected utility: Loss aversion
- Investors systematically violate Bayes rule and other axioms of probability theory: investors are subjected to heuristic biases.
- Representativeness (over -reaction)
- Availability bias (familiarity, home bias)
- Anchoring and adjustment (conservatism, underreaction)
- People make different choices depending on how equivalent decisions are presented to them: Frame dependence